People live digital lives and generate a lot of data. Group chats is one place where such traces of activity are preserved and can reveal interesting facts about the society structure and the individuals in it. We use Telegram as a messenger for some company-wide chats. In this article we demonstrate how to easily pull a Telegram chat message history and perform some basic analysis on it.
Disclaimer: all the personal identifiable information s.a. individual names and chat names are intentionally pseudonymized to not be revealed in the final report. This is configurable and done on the report forming level, so that whoever owns the data could attribute the stats to the real individuals. More on pseudonymization below.
Result: here is the anonymized report you can checkout - this is a result of executing the script which fetches and analyses several company wide chats.
Code (but of course not data) is available here: https://github.com/justadreamer/tghistory
Tools
Unlike the previous article where we used only SQL queries - the main tool for analysis used here is R. R is an excellent choice of a language and environment for data manipulation, analysis and graphing. Especially relatively simple exploratory data analysis which mainly consists in grouping by various criteria and obtaining summary statistics. R is highly extensible and comes with packages which enable literate programming and nice report generation - all done from a single RMarkdown document.
To fetch Telegram message history (ETL step = extract, transform, load) we used a Python script with a dependency on python-telegram - a wrapper over TDLib ("Telegram Database") - a cross-platform library for building Telegram clients. TDLib is an asynchronous library which handles networking, caching and data structures to provide an application with everything necessary to be a functional Telegram client.
PostgreSQL DB schema is below. Just 3 simple tables which contain just a tiny subset of the data fields which TDLib makes available for each entity.
PostgreSQL DB schema is below. Just 3 simple tables which contain just a tiny subset of the data fields which TDLib makes available for each entity.

Solution Architecture
The flow is 2-step.
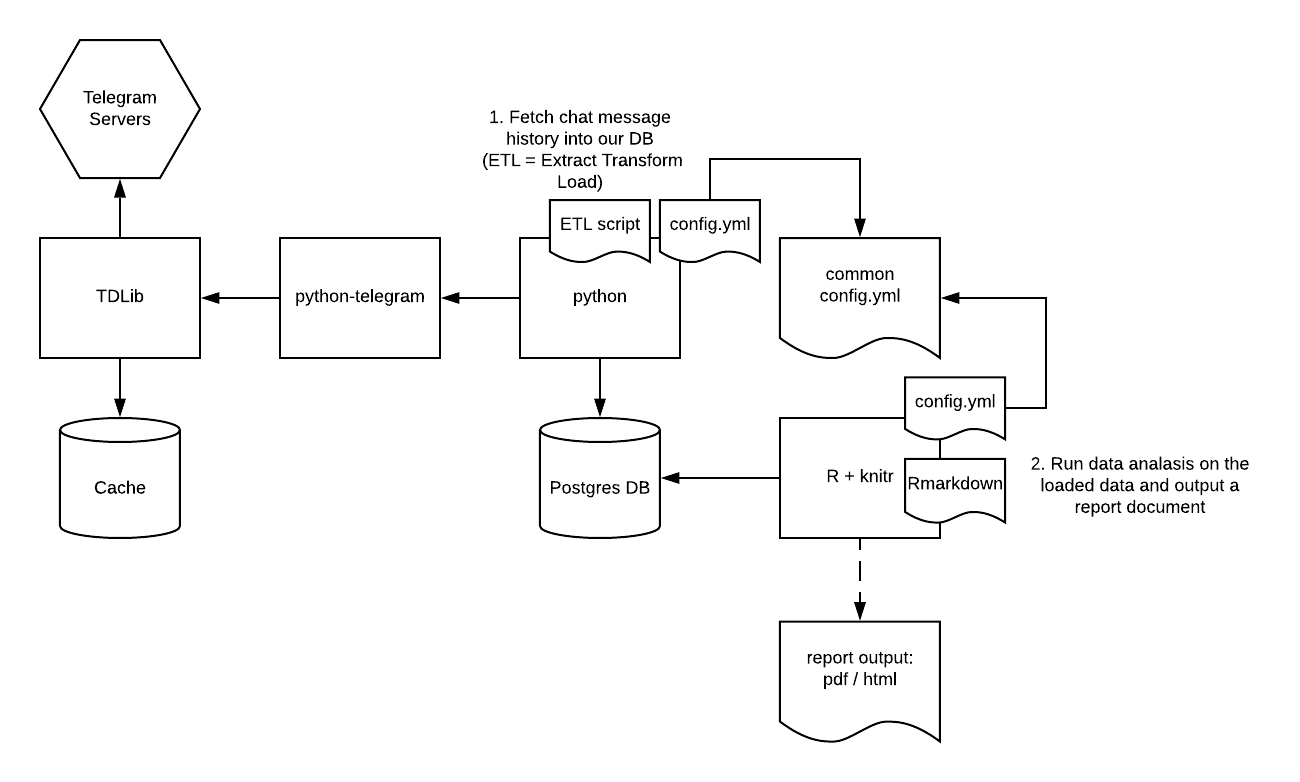
First we extract chat message history using a python ETL script and load it into the Postgres DB, TDLib manages its own local message cache and we interact with it thru python-telegram wrapper.
Second we launch the knitr tool and feed it an R Markdown document which is a text report in Markdown interspersed with R snippets which are actually executed and perform the data manipulation, analysis and graphing.
R loads the data from the same Postgres DB we saved the messages into and is using the same config.yml file the ETL script uses - thus there is a guaranteed single source of truth for both parts of the system.
The dependency scheme is shown below:
Anonymization
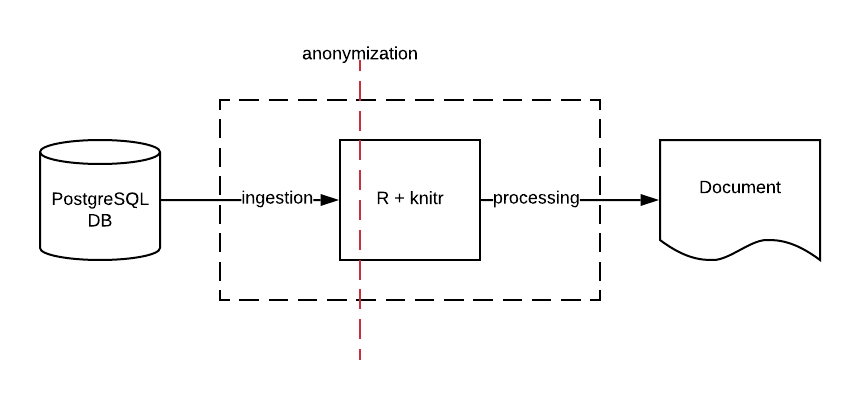
It deserves a couple words. We anonymize or rather pseudonymize the data at an ingestion step - when it is loaded from a DB into R environment:
We borrow a list of animals used in Google Drive and make a reversible map of original usernames / chat titles to the anonymized ones made up of an animal name and a suffix. For a chat the suffix is "Chat", for the user the suffix is "Anonymous" - just to distinguish the entities. Once the data is ingested - it contains only anonymized entities and all further analysis is done on the anonymized entities. This means that you can not accidentally mention any real name in the produced report unless only by hardcoding it, because the ingested data you work with contains only anonymized names.
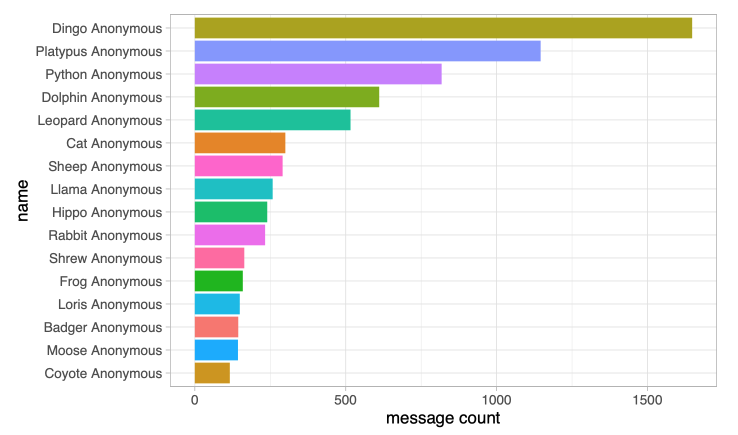
I mentioned that the map is bi-directional - that is we can deanonymize any name. With a small caveat that we have around 80 animals in the animals.txt file while there might be more users than animals - this means we need to reuse some animals if we have a list of anonymized entities longer than the list of animals - probably adding an index to a anonymized name if it is already present in a list. As a result of anonymization we get stats of this kind:
I mentioned that the map is bi-directional - that is we can deanonymize any name. With a small caveat that we have around 80 animals in the animals.txt file while there might be more users than animals - this means we need to reuse some animals if we have a list of anonymized entities longer than the list of animals - probably adding an index to a anonymized name if it is already present in a list. As a result of anonymization we get stats of this kind:
Stats
In the report we compute and graph the following stats:
1. The total number of messages in each chat of interest. We choose the chat with the highest number of messages as the one to analyze.
2. The distribution of messages by user.
3. The distribution of messages by day of week.
4. The distribution of messages by user and day of week.
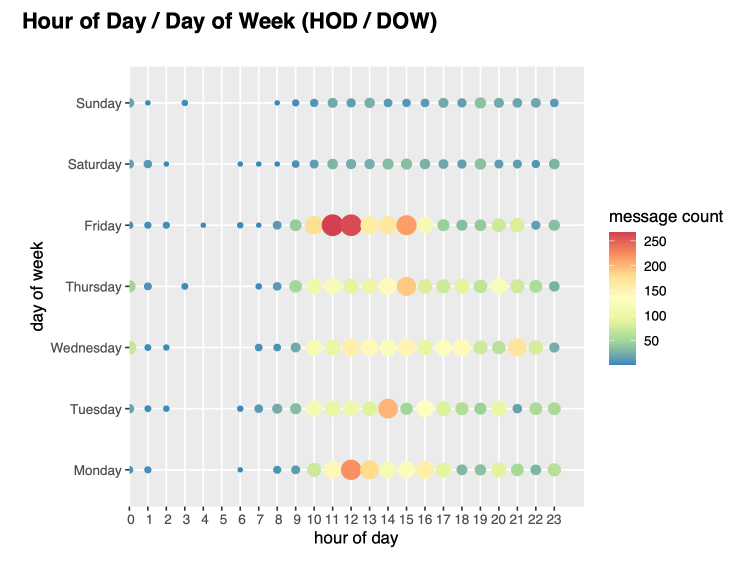
5. The distribution of messages by day of week and hour of day.
6. The distribution of messages by person and by hour of day in the heaviest day of week.
7. The distribution of messages by content type.
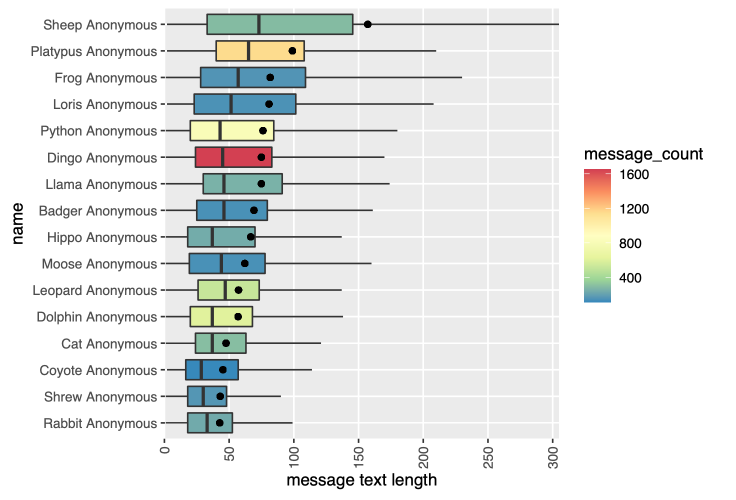
8. The message length - min, max, IQR, median, mean.
9. Conversation analysis - who are the conversation starters and supporters.
Here are the most interesting distributions:
1. The total number of messages in each chat of interest. We choose the chat with the highest number of messages as the one to analyze.
2. The distribution of messages by user.
3. The distribution of messages by day of week.
4. The distribution of messages by user and day of week.
5. The distribution of messages by day of week and hour of day.
6. The distribution of messages by person and by hour of day in the heaviest day of week.
7. The distribution of messages by content type.
8. The message length - min, max, IQR, median, mean.
9. Conversation analysis - who are the conversation starters and supporters.
Here are the most interesting distributions:
Day of week and hour of day:
Hour of day and user on Friday:
Text message lengths:
Checkout the full report here.